
The Importance of Diversification in Volatile Markets

In the past two weeks, global financial markets have experienced significant turmoil, marked by a sharp sell-off across various indices. Concerns over tech stock valuations, the impact of Japan's unexpected interest rate hike, and lower-than-anticipated job data in the US have fuelled fears of an economic slowdown and potential recession. These developments underscore the critical importance of diversification in investment strategies, particularly during periods of heightened volatility.
Current Market Context
Recent market activity has been turbulent, with the Nasdaq 100 dropping nearly 6%, and the Dow Jones Industrial Average shedding over 1,000 points in a single day. The sell-off, which began with disappointing earnings reports from major tech companies and a weak July jobs report, was exacerbated by Japan's surprise interest rate increase and Berkshire Hathaway's significant reduction of its Apple stake. As a result, investor sentiment has been rattled, leading to a broad-based retreat from equities.
The Cboe Volatility Index (VIX), Wall Street's "fear gauge," surged to its highest level since the onset of the COVID-19 pandemic, reflecting the growing anxiety among investors. Economic indicators such as the rising unemployment rate and concerns about the Federal Reserve's monetary policy have further contributed to the market's instability. Analysts suggest that a sustained recovery will require multiple catalysts, including stabilisation of the yen, robust earnings reports, and positive economic data.
Importance of Diversification
Diversification is a fundamental principle of sound investment strategy. It involves spreading investments across different asset classes to reduce exposure to any single asset or risk. The recent market sell-off highlights how quickly significant value can be lost in concentrated investments, particularly in highly volatile sectors like technology.
Wine as a Diversification Asset
Wine, as an alternative investment, offers unique advantages for diversification. Historically, the fine wine market has demonstrated resilience and growth, often moving independently of traditional financial markets. This characteristic makes wine an attractive asset for investors seeking to mitigate risk and enhance portfolio stability.
The purpose of undertaking this analysis was to investigate the data and evaluate whether wine is truly uncorrelated and could provide investors with much-needed diversification and shelter from financial market volatility.
To undertake this analysis, we used monthly return data from Liv-ex to represent our view of the wine market. We created a blended index using regional indices from the Liv-ex 1000 to represent our view of the wine market. The Liv-ex 100, while a benchmark, is overly focused on Bordeaux. Our blended index includes 35% Burgundy, 30% Bordeaux, 15% Italy, 10% Champagne, 7% Rest of the World, and 3% Rhône.
We chose to compare this wine index to the S&P 500, the globally recognised leading stock market index, and the MSCI World Index to provide a more representative view of global markets.
Data Analysis and Findings
Correlation and Volatility Analysis
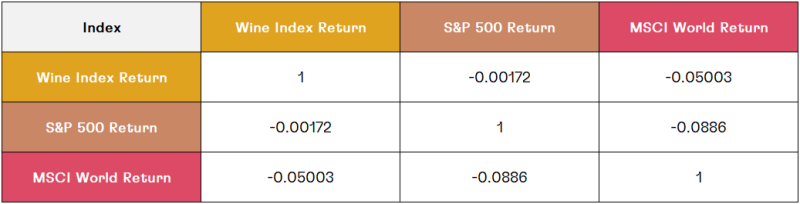
The analysis of the Wine Index (Cult Blend) from 2004 to 2024 reveals an exceptionally low correlation with both the S&P 500 and MSCI World Index, underscoring its potential as a diversification asset. The wine index also exhibits lower volatility compared to these stock indices, suggesting greater stability over time.
Volatility Analysis
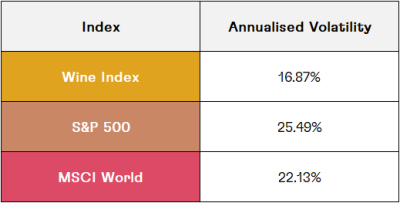
The annualised volatility analysis shows that the wine index is less volatile compared to the S&P 500 and MSCI World Index.
Interpretation
- The wine index shows an extremely low and negative correlation with both the S&P 500 and MSCI World Index, indicating it behaves quite independently from these stock indices.
- The wine index is less volatile compared to both the S&P 500 and MSCI World Index on an annualised basis, suggesting it might be a more stable investment over time.
Event Studies
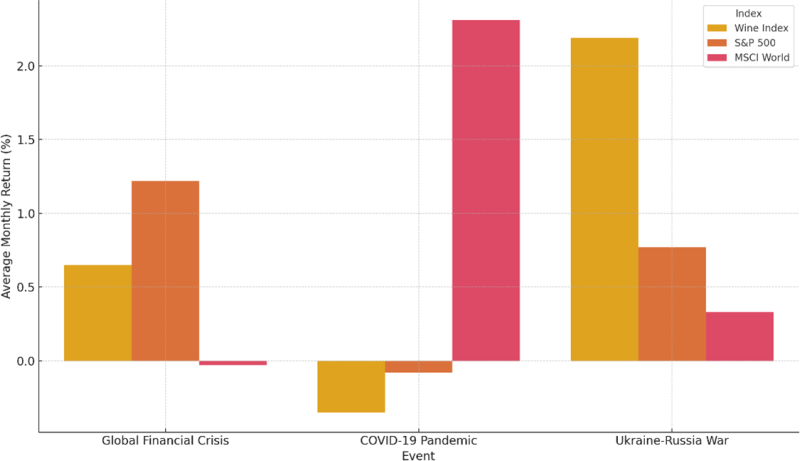
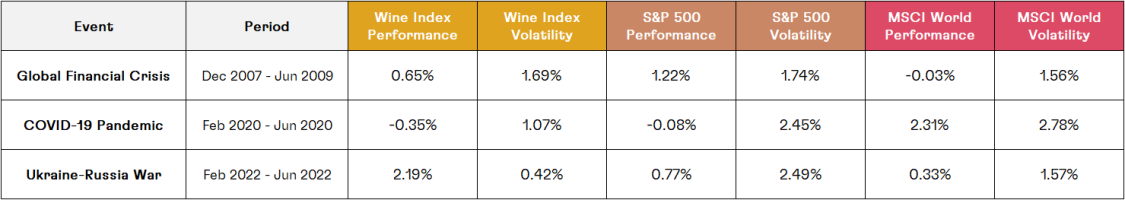
During major economic events such as the Global Financial Crisis, the COVID-19 pandemic, and the recent Ukraine-Russia conflict, the wine index demonstrated resilience and maintained lower volatility compared to the stock markets.
Performance Comparison During Major Economic Events
Volatility Comparison During Major Economic Events
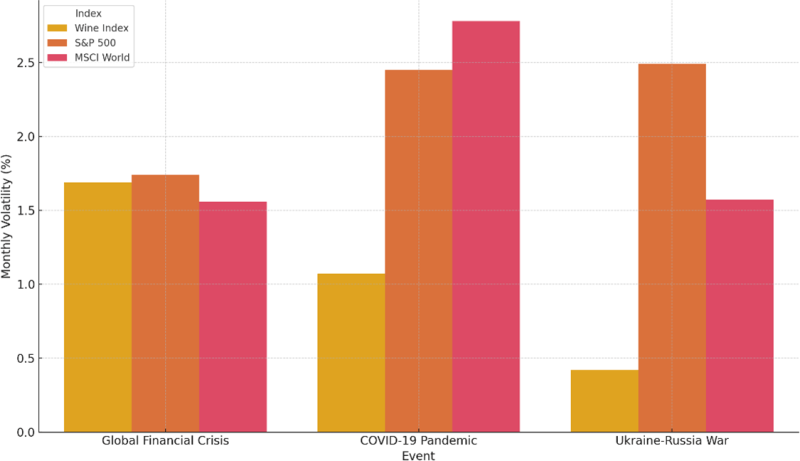
- During the Global Financial Crisis, the wine index showed positive returns with relatively low volatility compared to the stock indices.
- During the COVID-19 pandemic, the wine index experienced a slight decline, but its volatility was significantly lower than the stock indices.
- During the Ukraine-Russia war period, the wine index exhibited impressive performance with very low volatility compared to the stock indices.

Fine Wine Investment Guide 2025
Download your guide to fine wine investing and discover how this unique, tangible, and tax-efficient asset can enhance portfolio diversification. Gain valuable knowledge and insights with this indispensable document for investors.
Risk-Adjusted Performance
Sharpe Ratio Explained
The Sharpe ratio is a measure used to evaluate the risk-adjusted return of an investment. The ratio helps investors understand how much excess return they are receiving for the extra volatility that they endure for holding a riskier asset.
Interpretation
- Higher Sharpe Ratio: Indicates a more attractive risk-adjusted return. It means the investment is generating higher returns for a given level of risk.
- Lower Sharpe Ratio: Suggests a less attractive risk-adjusted return, implying the investment may not be adequately compensating for the level of risk taken.
In the context of our analysis, the Sharpe ratio is used to compare the risk-adjusted performance of the wine index (Cult Blend) with traditional financial market indices like the S&P 500 and MSCI World Index. By doing so, we can assess whether the wine index provides superior returns for its level of risk compared to these stock market benchmarks.
The wine index outperforms both the S&P 500 and MSCI World Index in terms of risk-adjusted returns, as indicated by higher Sharpe and Sortino ratios.
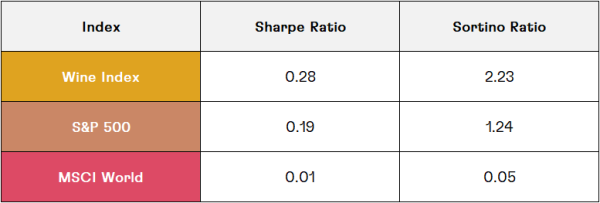
- With a Sharpe ratio of 0.28, the wine index offers a better risk-adjusted return compared to the S&P 500 and MSCI World Index. This suggests that, despite its lower volatility, the wine index provides relatively higher returns for the level of risk taken.
- The Sortino Ratio, which considers only downside volatility, is significantly higher for the wine index compared to the stock indices, suggesting it provides better risk-adjusted returns when considering only negative returns.
Regression Analysis
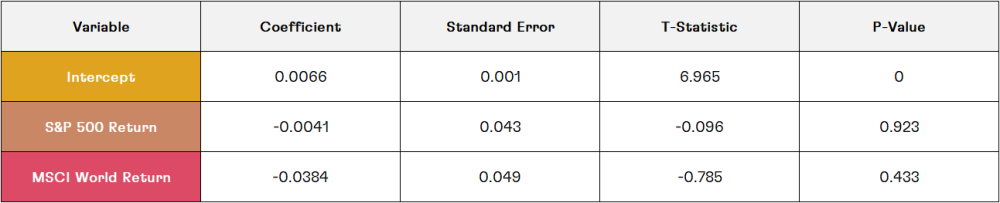
Regression analysis is a statistical method used to determine the relationship between a dependent variable and one or more independent variables. In this scenario, we used regression analysis to understand the relationship between the wine index returns and the returns of the S&P 500 and MSCI World Index. The goal was to determine if the wine index is influenced by the movements in these stock indices. The results showed that the wine index's returns are not significantly influenced by the movements of the S&P 500 and MSCI World Index, reinforcing its low correlation with traditional financial markets.
Interpretation
- The intercept suggests a positive average monthly return for the wine index.
- The beta values for both the S&P 500 and MSCI World returns are not statistically significant, indicating that the wine index's returns are not strongly influenced by the returns of these stock indices.
- The incredibly low R-squared value reinforces the low correlation between the wine index and stock market indices, suggesting that the wine index moves independently of the stock markets.
Cumulative Returns
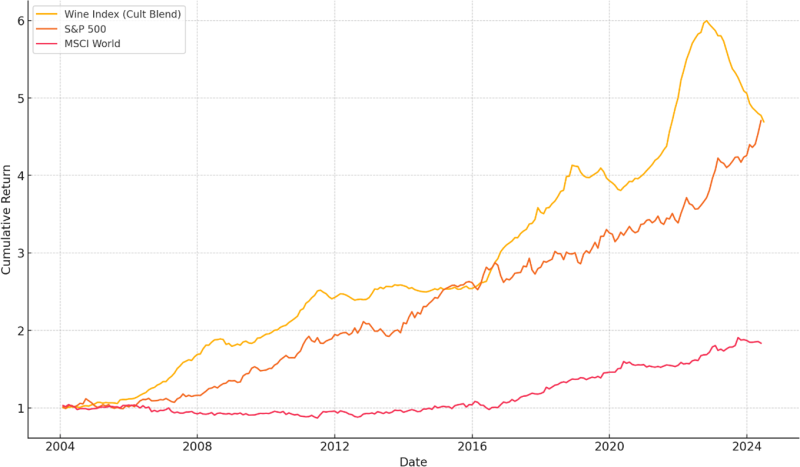
The cumulative returns plot shows the long-term growth of the Wine Index (Cult Blend) compared to the S&P 500 and MSCI World Index, highlighting the robust performance of the wine index over the period.
Cumulative Returns (2004-2024)
Observations
- The Wine Index (Cult Blend) has outperformed both the S&P 500 and MSCI World Index over the long term.
- The Wine Index exhibits significant growth, especially after 2012, indicating a strong upward trend.
- Both the S&P 500 and MSCI World Index show steady growth but with more pronounced volatility during specific periods.
Current Market Opportunity
The cumulative returns graph and the monthly returns data reveal that wine prices and the wine index have experienced a significant decline over the past 12-18 months, while stock market indices have continued to climb. This recent downturn in wine prices, coupled with the current volatility and sell-off in global markets, presents a compelling entry point for investors.
Given the benefits of wine as an uncorrelated asset with lower volatility, deploying capital into wine right now, while prices have come off their highs, could offer a strategic advantage. Investors can potentially acquire fine wine at more attractive valuations, positioning themselves to benefit from future appreciation as the market stabilises and grows.
Rolling Correlations
The rolling correlations plot illustrates the fluctuating relationship between the wine index and the stock indices, with correlations often being low or negative.
Rolling Correlations (12-Month Window)
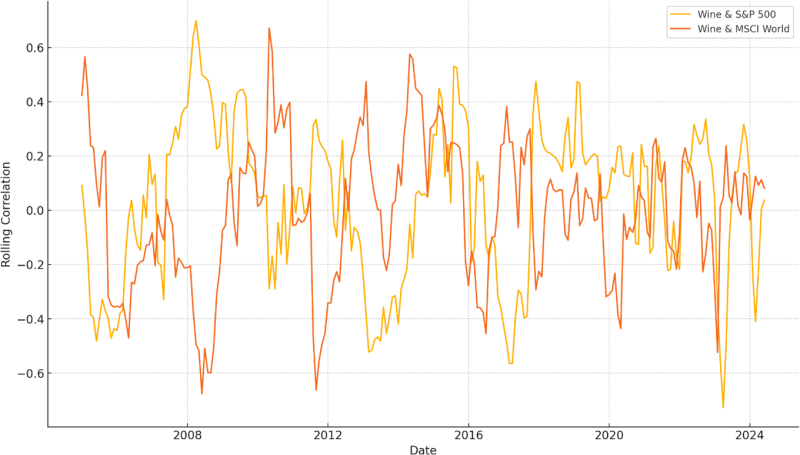
Observations
- The correlations between the wine index and the stock indices fluctuate significantly over time.
- There are periods where the correlation is positive, but there are also many periods where it is negative or close to zero.
- The wine index demonstrates a low and unstable correlation with both the S&P 500 and MSCI World Index, reinforcing its potential as a diversification asset.
Rolling Volatility
The rolling volatility plot demonstrates the stability of the wine index compared to the higher and more variable volatility of the stock indices.
Rolling Volatilities (12-Month Window)
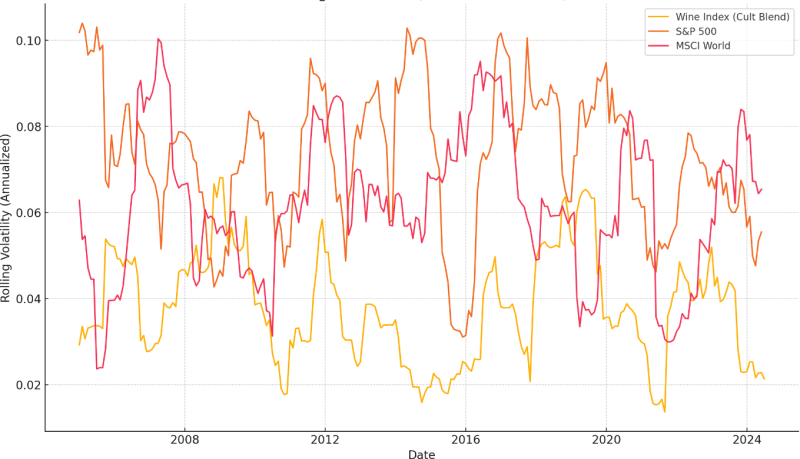
Observations
- The rolling volatility of the wine index is generally lower than that of both the S&P 500 and MSCI World Index.
- The volatility of the wine index appears to be more stable over time compared to the stock indices.
- Both the S&P 500 and MSCI World Index exhibit higher and more variable volatility, especially during periods of economic instability.
Summary and Implications
Considering the recent market volatility, the importance of a diversified investment portfolio has never been clearer. The fine wine market, with its historical resilience and low correlation to traditional financial markets, offers a compelling case for inclusion in a diversified investment strategy. By incorporating alternative assets like wine, investors can better navigate market uncertainties and enhance their portfolio's overall stability and performance.
The fine wine market presents a unique and valuable opportunity for investors seeking to diversify their portfolios and protect against market volatility. We encourage you to explore wine's potential as an alternative investment and consider its benefits for long-term portfolio diversification.
Related Articles